
In today’s data-centric business environment, organizations need to leverage powerful tools like Power BI to transform raw data into actionable insights. Power BI, a suite of business analytics tools from Microsoft, enables companies to visualize data, share insights, and make data-driven decisions in real time. This article delves into the essential skills required to master Power BI and enhance your ability to influence strategic decision-making.
Ready to take your Business Intelligence skills to the next level? Check out our comprehensive Mastering Business Intelligence with Power BI course.

Understanding the Power BI Ecosystem
The Power BI ecosystem consists of several components that work together to provide comprehensive data analytics and reporting solutions. It includes:
Power BI Desktop
Power BI Desktop is the primary development environment for creating reports and data models. It offers a range of features like drag-and-drop functionality, custom visualizations, and advanced data modeling capabilities.
Power BI Service
The Power BI Service is a cloud-based platform that allows users to publish, share, and collaborate on reports and dashboards. It also includes features for setting up data refresh schedules, creating workspaces, and managing data gateways.
Power BI Mobile
Power BI Mobile enables users to access and interact with their reports and dashboards on mobile devices, ensuring that insights are available anytime, anywhere.
Power BI Embedded
Power BI Embedded allows developers to integrate Power BI reports and dashboards into custom applications, providing a seamless user experience.
Core Skills for Mastering Power BI
To excel in Power BI, you must develop a combination of technical and analytical skills. Below are the core competencies essential for mastering Power BI:
1. Data Connectivity and Integration
Power BI supports a wide range of data sources, including SQL databases, Excel files, cloud services like Azure, and online platforms such as Google Analytics. Mastering data connectivity involves:
- Understanding different types of data sources.
- Connecting to multiple data sources.
- Importing data and setting up real-time data refresh.
- Combining data from different sources using Power Query.
2. Data Modeling and Transformation
Data modeling is the backbone of any Power BI report. It involves organizing and structuring data in a way that supports efficient analysis and reporting. Key aspects include:
- Creating and managing relationships between tables.
- Defining calculated columns and measures using DAX (Data Analysis Expressions).
- Implementing data transformations using Power Query Editor.
- Optimizing data models for performance and scalability.
3. DAX (Data Analysis Expressions)
DAX is the formula language used in Power BI for creating custom calculations and aggregations. Proficiency in DAX is critical for building sophisticated data models and reports. Important DAX skills include:
- Writing basic to advanced DAX formulas.
- Creating calculated columns and measures.
- Implementing time intelligence functions.
- Debugging and optimizing DAX code for performance.
4. Data Visualization and Report Design
Effective data visualization is key to communicating insights clearly. Power BI offers a wide range of visualization options, including bar charts, line graphs, scatter plots, and custom visuals. Essential visualization skills include:
- Choosing the right visualizations for your data.
- Customizing visuals to enhance readability and impact.
- Using slicers, filters, and drill-through features to create interactive reports.
- Designing intuitive and aesthetically pleasing dashboards.
5. Advanced Analytics and AI Integration
Power BI integrates with advanced analytics and AI capabilities, enabling users to perform predictive analysis and gain deeper insights. Key areas to focus on include:
- Using AI visuals like Key Influencers and Decomposition Tree.
- Integrating Power BI with Azure Machine Learning for predictive analytics.
- Implementing R and Python scripts within Power BI for custom analytics.
- Leveraging the Q&A feature for natural language queries.
6. Collaboration and Sharing
Collaboration is an essential aspect of using Power BI within an organization. Power BI provides several options for sharing reports and dashboards, including:
- Publishing reports to the Power BI Service.
- Creating and managing workspaces for collaboration.
- Setting up row-level security to control data access.
- Embedding reports in SharePoint, Teams, or custom applications.
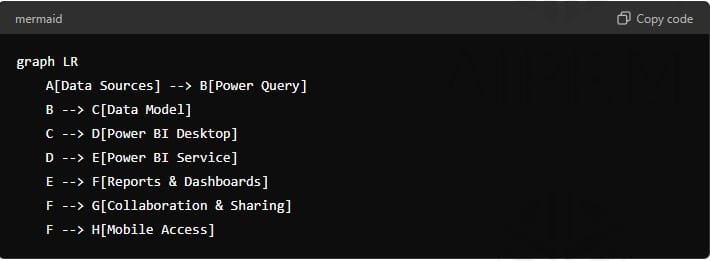
Diagram: Power BI Data Flow
Best Practices for Optimizing Power BI Performance
Optimizing Power BI performance is crucial for ensuring that reports load quickly and provide accurate insights. Here are some best practices to follow:
1. Efficient Data Modeling
- Use star schema design to organize your data model.
- Avoid using too many calculated columns; prefer measures instead.
- Reduce the size of your data model by filtering unnecessary rows and columns.
2. Optimizing DAX Queries
- Use star schema design to organize your data model.
- Avoid using too many calculated columns; prefer measures instead.
- Reduce the size of your data model by filtering unnecessary rows and columns.
3. Managing Data Refresh
- Schedule data refresh during off-peak hours to avoid performance bottlenecks.
- Use incremental refresh for large datasets.
- Monitor refresh history to troubleshoot and optimize data refresh times.
4. Reducing Report Load Time
- Limit the number of visuals on a single report page.
- Use bookmarks and buttons to create multi-page reports with a cleaner design.
- Optimize the use of visuals like cards and KPIs to reduce the processing load.
Ready to take your Business Intelligence skills to the next level? Check out our comprehensive Mastering Business Intelligence with Power BI course.
Conclusion: Leveraging Power BI for Business Success
Mastering Power BI is not just about learning the technical skills; it’s about applying these skills to drive business success. By harnessing the power of data connectivity, modeling, visualization, and advanced analytics, organizations can transform their data into actionable insights. Power BI empowers users to make informed decisions, leading to increased efficiency, productivity, and competitive advantage.
Investing time in learning and mastering Power BI will equip you with the tools needed to navigate the complexities of modern data analysis and help your organization thrive in a data-driven world.
FAQ: Power BI Mastery and Applications
Q1: What is Power BI and why is it important?
Power BI is a suite of business analytics tools from Microsoft designed to help organizations visualize data, share insights, and make data-driven decisions. It is important because it enables users to create interactive reports and dashboards, integrate data from multiple sources, and perform advanced analytics, thereby improving decision-making and operational efficiency.
Q2: What are the main components of the Power BI ecosystem?
The main components of the Power BI ecosystem are:
- Power BI Desktop: A development environment for creating reports and data models.
- Power BI Service: A cloud-based platform for publishing, sharing, and collaborating on reports and dashboards.
- Power BI Mobile: An application for accessing and interacting with Power BI reports on mobile devices.
- Power BI Embedded: A service that allows developers to integrate Power BI reports and dashboards into custom applications.
Q3: What core skills are required to master Power BI?
Core skills required to master Power BI include:
- Data Connectivity and Integration: Connecting to various data sources and integrating them.
- Data Modeling and Transformation: Organizing and structuring data for analysis, including using DAX for calculations.
- DAX (Data Analysis Expressions): Writing and optimizing DAX formulas for custom calculations.
- Data Visualization and Report Design: Creating and customizing visualizations to effectively communicate insights.
- Advanced Analytics and AI Integration: Leveraging AI capabilities and integrating with advanced analytics tools.
- Collaboration and Sharing: Publishing and sharing reports, managing workspaces, and setting up security.
Q4: How can Power BI be used in financial reporting and analysis?
Power BI can be used in financial reporting and analysis to:
- Monitor cash flow, track revenue, profit margins, and expenses.
- Analyze profitability by evaluating cost centers and revenue streams.
- Automate the generation of financial statements for stakeholders, enhancing transparency and accuracy.
Q5: What benefits does Power BI offer for sales and marketing?
For sales and marketing, Power BI helps:
- Measure campaign performance, including conversion rates and ROI.
- Segment customers based on various factors for targeted marketing.
- Forecast future sales and analyze trends for strategic planning.
Ready to take your Business Intelligence skills to the next level? Check out our comprehensive Mastering Business Intelligence with Power BI course.