Data-Driven Insights into India’s Retail Sector: Forecasting Consumer Spending Trends
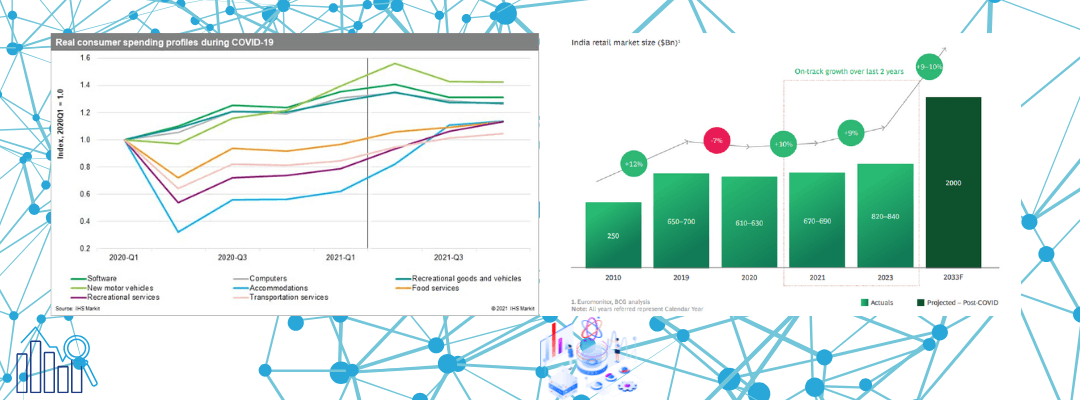
India’s retail sector has undergone significant transformation in recent years, driven by rapid urbanization, technological advancements, and evolving consumer behaviors. With the rising availability of data, retailers now have access to a wealth of information that can guide their decision-making processes and help forecast future trends. In this article, we will explore how data-driven insights … Read more